1-year Retrospective
August 2nd marked the 1-year anniversary of my first post, so it seems appropriate to do a quick retrospective of my first year blogging on my personal site.
Writing Stats
I’ve written 22 posts in that time, which is a rate of 1.83 per month. My (unstated) goal was 2 per month, so I wasn’t far off. My most prolific month is a tie between September 2013 and May 2014, in which I wrote 4 articles each. But in September I re-used some posts I had written previously for Optimizely, so May wins for more original content.
Sadly, there were two months in which I didn’t write any articles: Dec 2013, and July 2014. In December I was in India, so that’s a pretty legitimate reason. July, however, has no good reason. It was generally a busy month, but I should have made time to write at least one post. And looking closer, just saying “July” makes it sound better than it actually was - I had a seven week stretch of no posts then!
My longest article was “Re-Designing Optimizely’s Preview Tool”, clocking in at 4,158 words!
Site Analytics
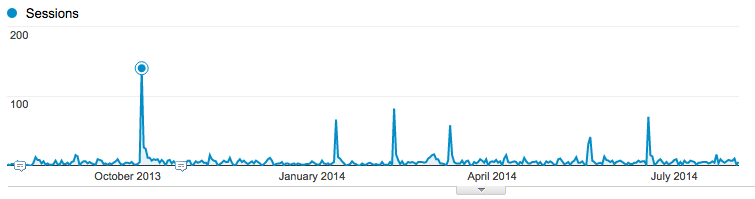
Diving into Google Analytics, I’ve had 3,092 page views, 2,158 sessions, and 1,778 users. I seem to get a steady trickle of traffic every day, with a few occasional spikes in activity (which are caused by retweets, Facebook posts, or sending posts to all of Optimizely). All of which I find pretty surprising since I don’t write very regularly, and I don’t do much to actively seek readers.
So where do these visitors (i.e. you) come from? Google Analytics tells me that, even more surprisingly, the top two sources are organic search and direct, respectively. From looking through the search terms used to find me, they can be grouped into three categories:
- My name: this is most likely people who are interviewing at Optimizely.
- Cloud.typography and Typekit comparison: people are interested in a performance comparison of these two services. And in fact, I wrote this article precisely because I was searching for that information myself, but there weren’t any posts about it.
- Framing messages: I wrote a post about the behavioral economics principle of framing, and how you can use it to generate A/B testing ideas. Apparently people want help writing headlines!
Top Posts
Continuing to dig into Google Analytics, these are my three most popular posts:
- “Extend – SASS’s Awkward Stepchild”, with 354 page views.
- “Re-Designing Optimizely’s Preview Tool”, with 306 page views.
- “Performance comparison of serving fonts through Typekit vs Cloud.typography”, with 302 page views.
They’re all pretty close in terms of traffic, but quite different in terms of content. So what does this tell me about what’s resonating with you, the reader, and what I should continue doing going forward? The main commonality is that all of those articles are original, in-depth content. In fact, this holds true past the top 10. My shorter posts that are responses to other people’s posts don’t receive as much mind share. I’ll have to think more about whether they’re worth doing at all anymore.
End
Overall I’m pretty satisfied with those numbers, and the content I’ve been able to produce. Going forward I hope I can write more in-depth content, especially about the design process of my projects (which are my favorite to write). Here’s to the upcoming year!